


Description
Being able to interpret and draw graphs in science is an imperative skill for students to develop. These science graphing worksheets are excellent for developing important skills in data analysis and graphing in science. These activities can be used as stand alone lessons, or to have on hand for early finishers. Part of the scientific method requires students to be able to display, analyze and report on scientific data. This booklet is a great way to help build students’ understanding of data in science, as well as build skills in interpreting and displaying data appropriately.
What can I use this science skills and graphing activities bundle for?
- graphing and data lessons
- early finisher work
- leave for a cover lesson / casual teacher
What the science skills and graphing activities bundle includes:
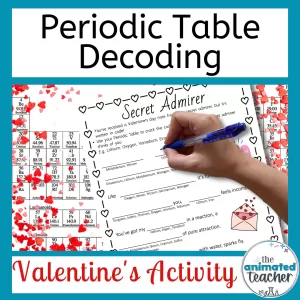
- 35 pages of student worksheets including close reading passages, interpreting graphs, drawing graphs and a murder mystery activity.
- Full teacher answer key
- Science Graphing digital escape room – pirate attack theme
- Science measurement digital escape room – witch’s potions theme
- Lab safety skills digital escape room – alien abduction theme
What the science graphing skills worksheets resource covers:
- types of data
- types of graphs
- interpreting data from a scientific graph
- where independent variables are on a graph
- where dependent variables are on a graph
- column graphs
- interpreting column graphs
- creating column graphs from data sets
- scatter graphs / scatter plots
- interpreting scatter plots
- lines of best fit
- scatter graph correlations
- drawing scatter graphs from data table
- line graph
- interpreting line graphs
- drawing their own graph, line graphs from data sets
- extension questions for critical thinking
- data examples relevant for general science, physical science, chemistry units and biology units.
- Note: this resource doesn’t include pie graphs.
Suitable for middle school science including 6th grade, 7th grade and 8th grade.

Reviews
There are no reviews yet.